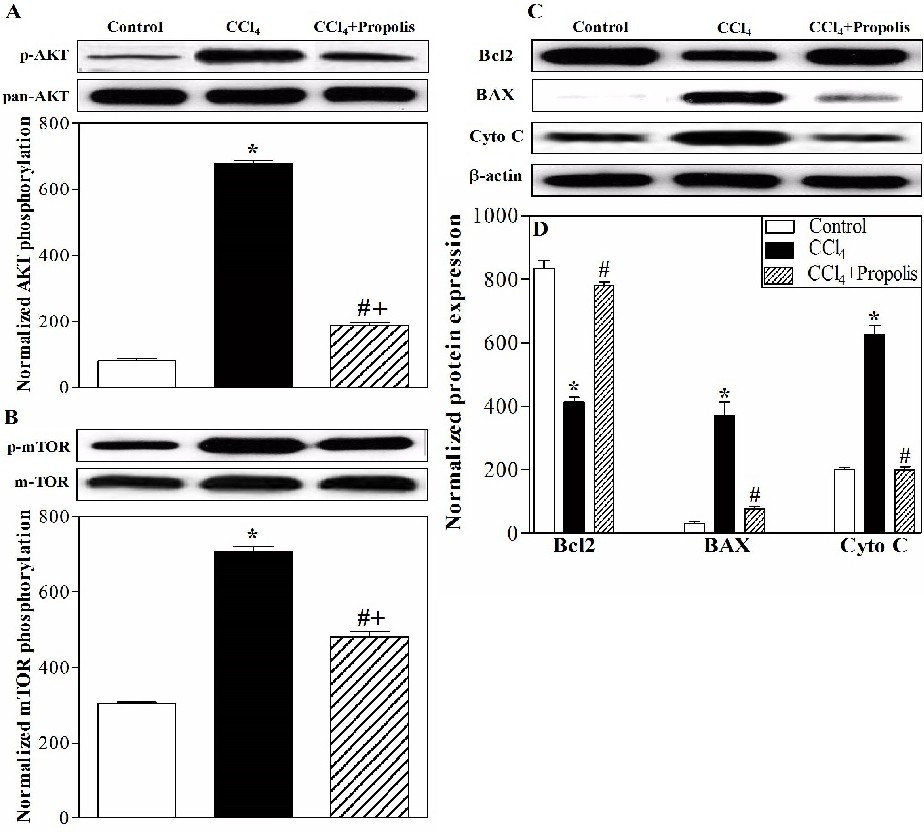
Fig. 8. Propolis repaired the liver architecture via PI3K/AKT/mTOR and Bcl2 family members. The liver lysates of the three animal groups were subjected to Western blotting using antibodies recognizing p-AKT, pan-AKT, p-mTOR, total-mTOR, Bcl2, BAX, cytochrome C and β-actin. The protein bands from one representative experiment are shown for the phosphorylation of AKT, phosphorylation of mTOR, the expression of Bcl2, the expression of BAX and the expression of cytochrome C. The levels of phosphorylated AKT (A) and mTOR (B) were normalized to total AKT and mTOR protein levels, respectively. The protein bands from one representative experiment for the expression of Bcl2, BAX, cytochrome C and β-actin are shown (C). The expression of Bcl2, BAX and cytochrome C was normalized to the total β-actin protein levels and accumulated data of five mice from the control group (open bars), CCl4-treated (closed black bars), and CCl4+propolis-treated (hatched bars) groups are expressed as the means ± SEM of the normalized value of each parameter, (n=5) (D). *P<0.05 for CCl4-treated mice versus control mice. #P<0.05 for CCl4+propolis-treated mice versus CCl4-treated mice. +P<0.05 for CCl4+propolis-treated mice versus control mice (ANOVA with Tukey's post-test).